Your Business Is Growing. But Something Underneath It Is Breaking.
Most founders don't lose because they lacked ambition. They lose because operational chaos outpaced their systems, and nobody was watching.
OR start with the
Do you recognize some of these:
Revenue is climbing, but margin is shrinking and you don't know exactly why
Your team is working harder than ever, but results are inconsistent
Vendors are dropping the ball and it's costing you customers
You're still making decisions you should have delegated six months ago
You can't take a week off without something going sideways
You hired great people but they're not performing the way you expected
These aren't people problems. They're operational problems. And they compound every single month they go unfixed.
Here's what's actually happening.
When a business grows faster than its systems, the founder becomes the system. Every decision, every escalation, every vendor call, every process gap, it runs through you.
At first, it felt necessary. Now it feels like a ceiling.
The longer this continues, the more expensive it becomes. Not just in time, in real dollars. Missed deadlines, margin erosion, vendor renegotiation failures, employee turnover, and customer experience breakdowns all trace back to the same root cause: operational infrastructure that never caught up with growth.
Fix the Foundation was built specifically for this moment.
WHAT FIX THE FOUNDATION INCLUDES
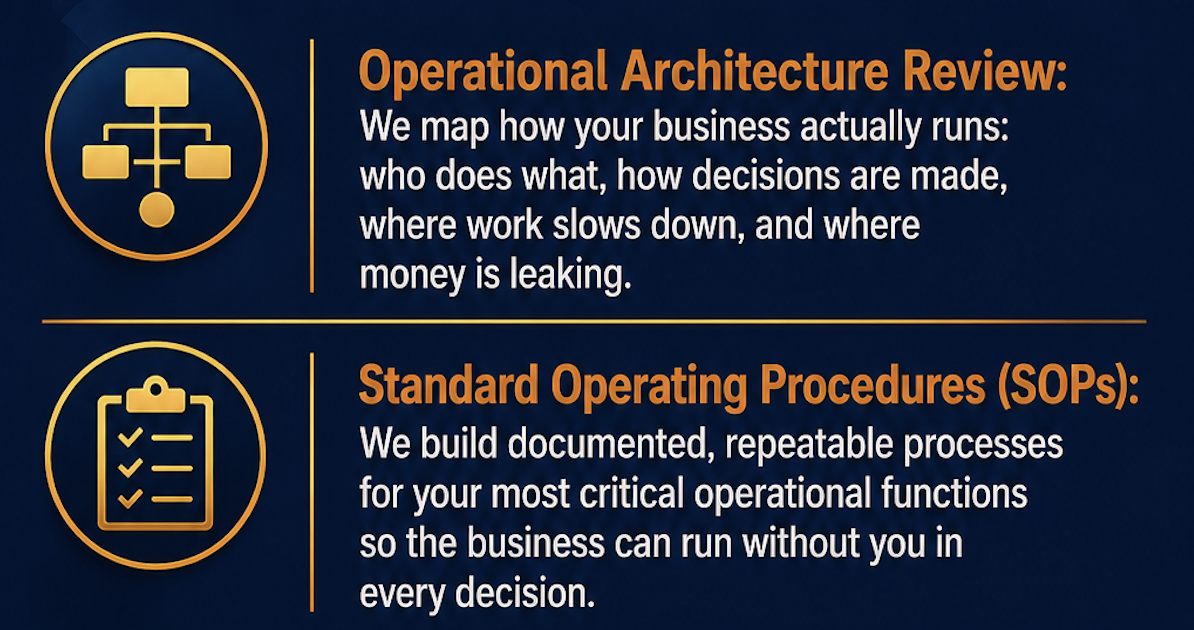
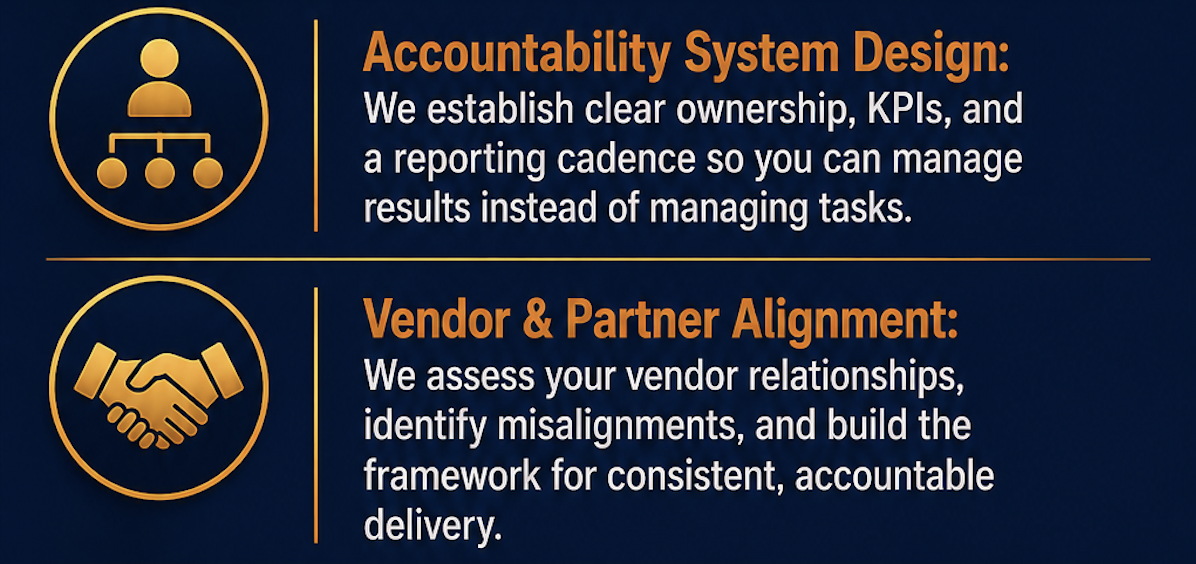
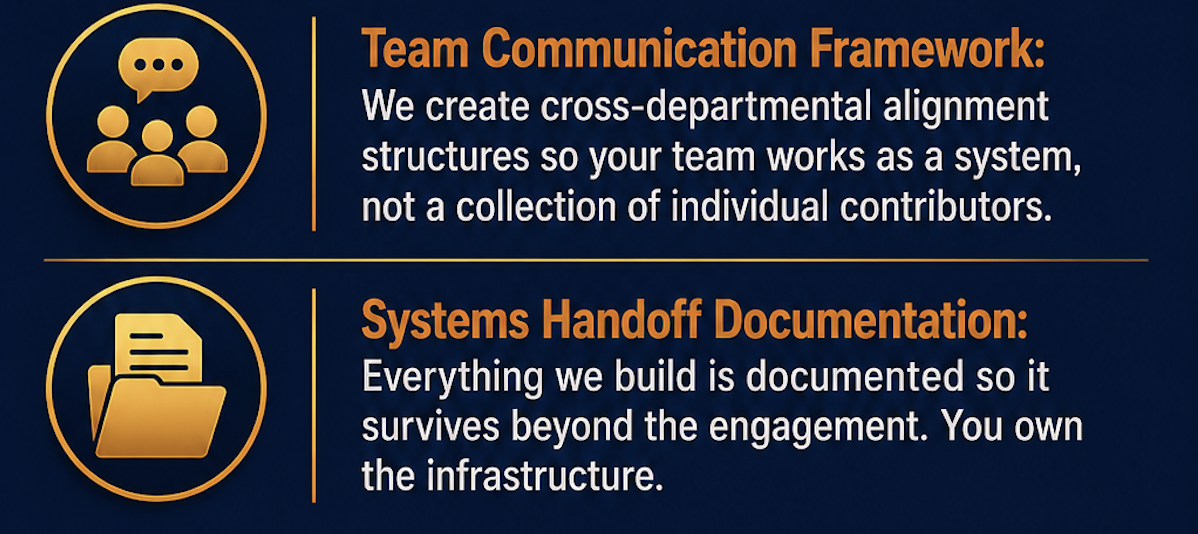
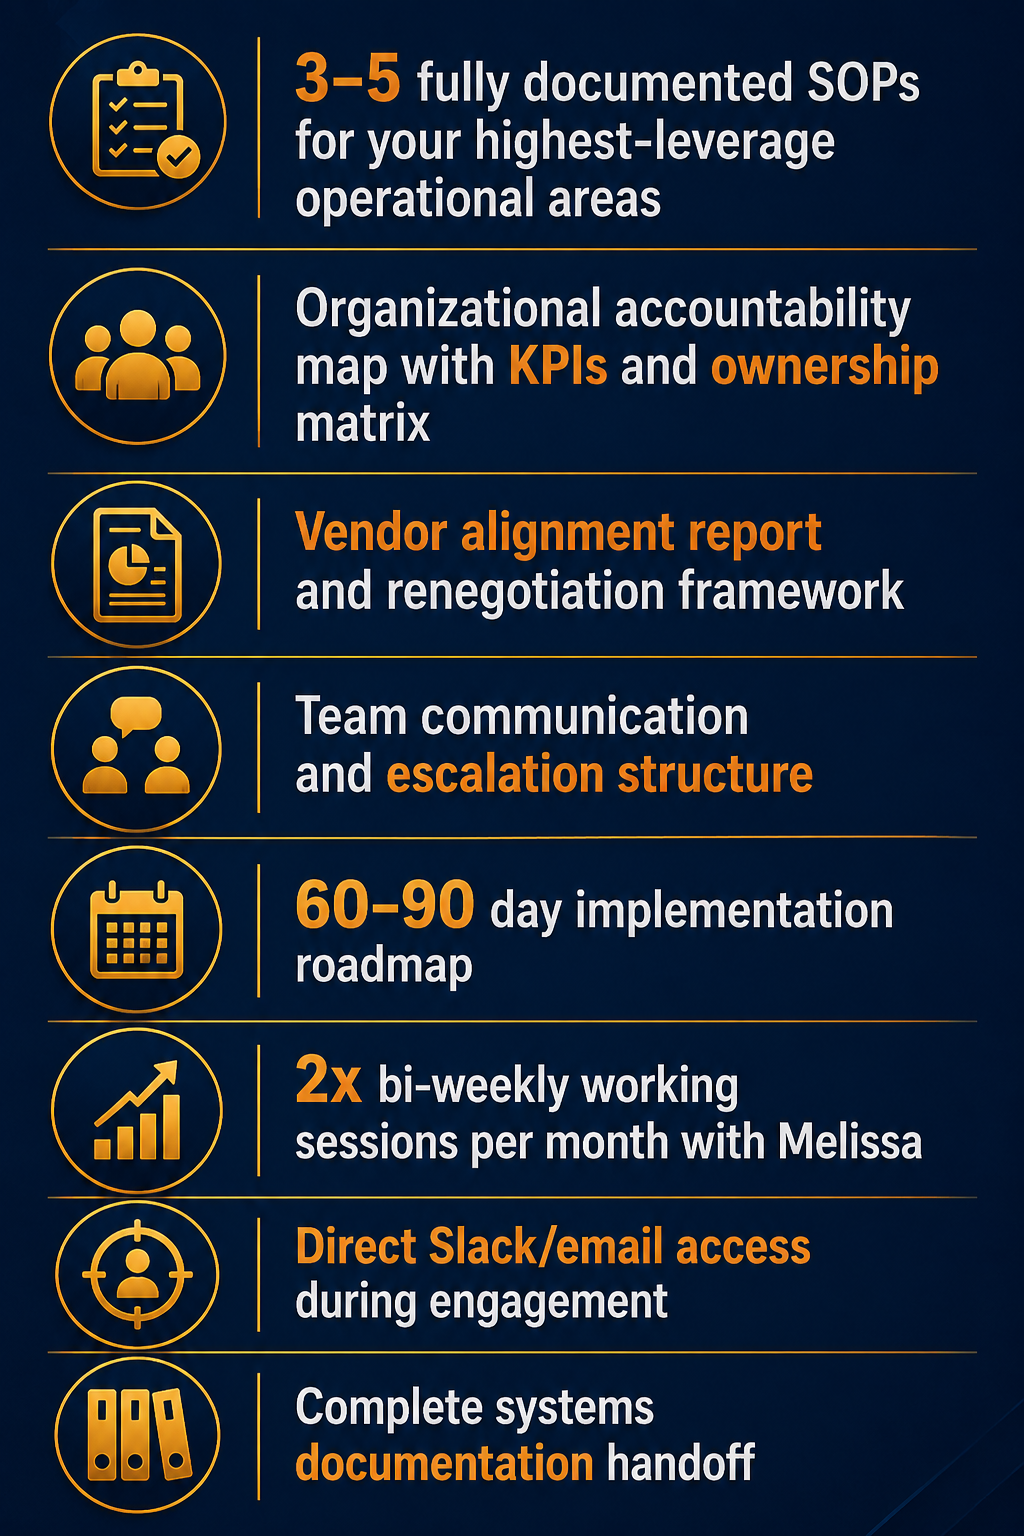
This is a 60-90 day operational build engagement. Here's exactly what we do:
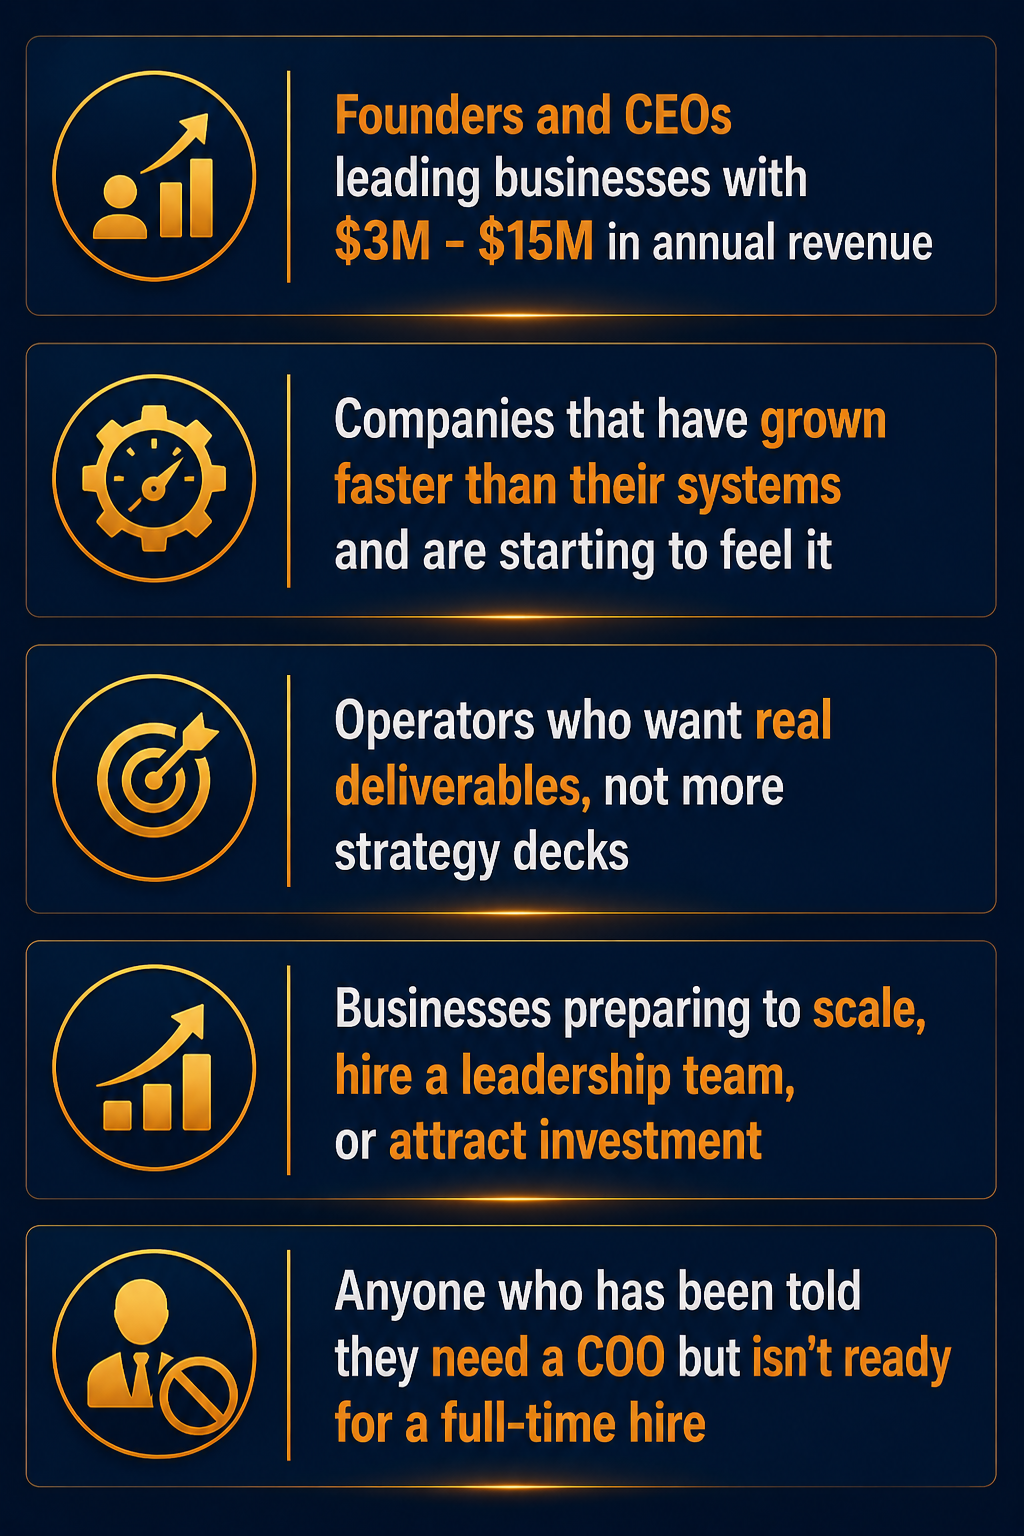
WHO IT’S FOR
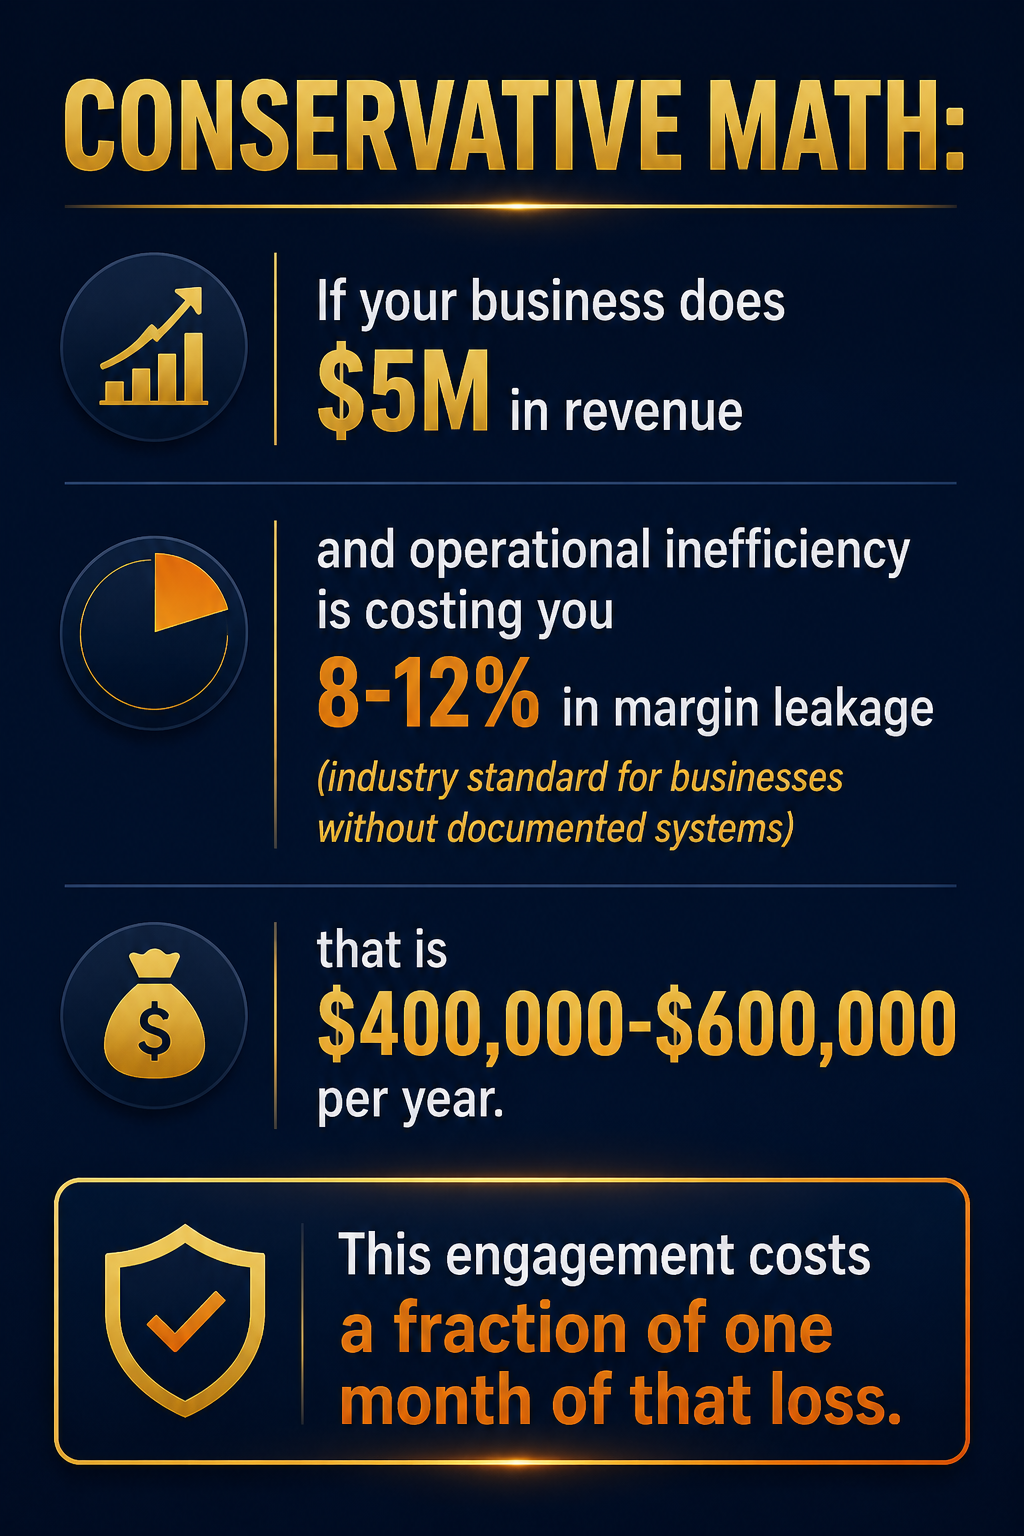
WHY IT MATTERS FINANCIALLY
WHAT YOU RECEIVE
Limited to 3 active engagements at a time. If you're ready to build the operational foundation your growth requires, apply now.
Not sure if this is the right fit? Start with the Operational Breakdown Audit, a diagnostic that identifies your top operational breakdowns and tells you exactly what needs to be fixed first.
-
Most clients report meaningful clarity and early structural wins within the first 30 days. Full systems are built and operational by the end of the engagement.
-
No. Fix the Foundation is designed for businesses at every team stage, from solo operators with contractors to companies with 10-50 employees.
-
That's exactly what the Operational Breakdown Audit is for. Complete the audit first, then use those findings to enter Fix the Foundation with complete clarity about what to build.
-
A full-time COO costs $150,000-$250,000 per year plus equity. This engagement costs a fraction of that, delivers specific deliverables within a defined timeline, and leaves you with documented systems your next hire can run.
-
While Efficient Edge Solutions has deep expertise in beverage, CPG, and supply chain-intensive businesses, the operational frameworks apply to any founder-led business in a growth phase. If you're unsure, the discovery call will tell us both.